Deep Dive into Understanding Data Aggregation: Definition, Examples, and Benefits

Understanding data aggregation is essential for anyone working with large volumes of data. In today’s information-driven world, data is collected at every point of interaction, but raw data alone can be overwhelming. By learning how to group, summarize, and interpret this data efficiently, professionals can gain clearer insights and make better decisions. This article explores the definition of data aggregation, provides practical examples, outlines key benefits, and offers guidance on how to apply this concept in real projects. If you want to turn complexity into clarity, this guide will walk you through the essentials of understanding data aggregation.
What Is Data Aggregation?
Data aggregation is the process of collecting and summarizing multiple pieces of information into a single view. Instead of analyzing each data point on its own, aggregation combines them to extract patterns and generate meaningful statistics. This allows users to work with smaller, more manageable datasets that still reflect the bigger picture.
For instance, a sales manager may aggregate daily transactions to see total monthly revenue. A website analyst might aggregate user clicks by hour or device type. In both cases, the goal is the same: reduce clutter and gain insight. Understanding data aggregation helps turn scattered records into structured intelligence.
Key Types of Data Aggregation
To apply aggregation effectively, it’s helpful to understand the different types commonly used in business and analytics settings:
- Time-based aggregation: Groups data into time intervals such as hours, days, or months.
- Category-based aggregation: Groups data by specific fields such as region, product type, or customer segment.
- Mathematical aggregation: Uses functions like sum, count, average, median, or standard deviation to summarize data.
Each method serves a unique purpose, and understanding data aggregation involves knowing when to apply which type depending on your goals.
Practical Examples of Understanding Data Aggregation
Let’s look at several real-world situations where understanding data aggregation improves clarity and decision-making:
- Retail: Aggregating customer purchases by product category to track top-selling items
- Healthcare: Summarizing patient metrics like blood pressure and glucose levels by age group
- Education: Grouping test scores by subject or teacher to evaluate performance trends
- Finance: Compiling monthly expenses across departments into quarterly reports
- Marketing: Tracking click-through rates across ad campaigns and summarizing them by platform
Each example shows how understanding data aggregation converts data overload into actionable insights. These summaries guide better resource allocation, campaign optimization, and operational efficiency.
The Benefits of Understanding Data Aggregation
Mastering the skill of understanding data aggregation offers a range of benefits across industries. Here are several ways aggregation adds value:
- Enhanced visibility: Aggregated data provides high-level summaries for executive decision-making
- Faster analysis: It reduces the volume of data to process, enabling quicker insights
- Better comparisons: Summarized values make it easier to track changes over time or between groups
- Reduced noise: Aggregation smooths out inconsistencies and highlights underlying trends
- Greater clarity: Raw data can be chaotic, but aggregation reveals structure and meaning
Understanding data aggregation brings simplicity to otherwise complex analytics. It supports long-term strategic planning as well as short-term decision-making.
Understanding Data Aggregation in BI Tools
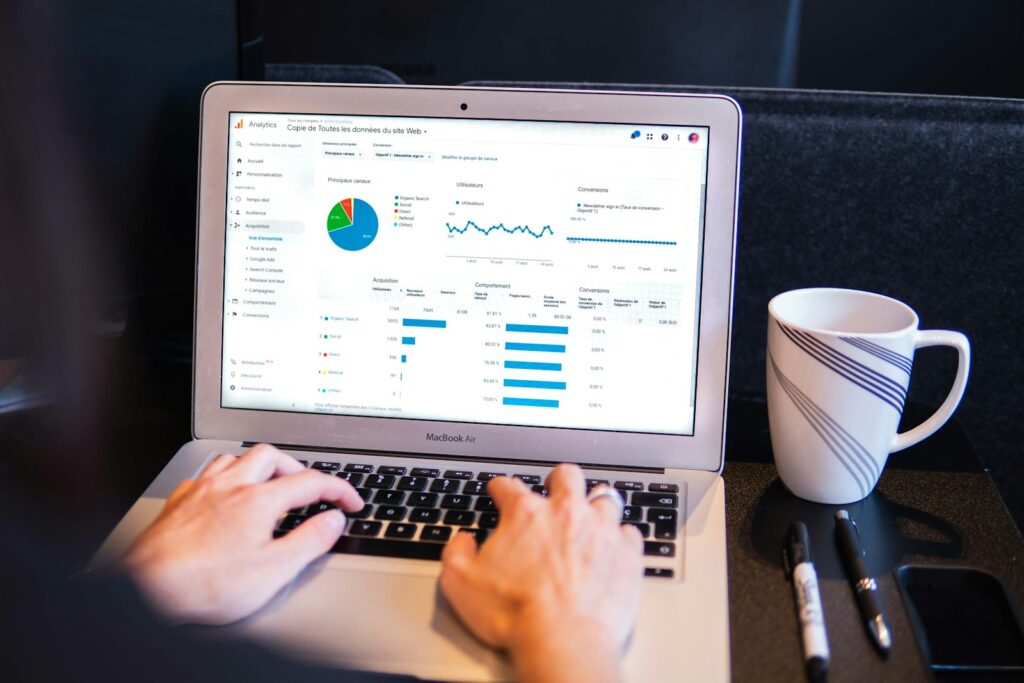
Many tools include native support for data aggregation, allowing users to manipulate large datasets with ease. For example, Microsoft Power BI, Google Data Studio, and Tableau all let users group data by date, category, or custom filters. These platforms rely on aggregation to display charts, reports, and dashboards that tell a story without overwhelming the viewer.
For example, a business might use Tableau to display monthly sales per region using bar charts. Power BI could present an average customer rating per product using a heatmap. These tools make understanding data aggregation an accessible and powerful skill.
Using SQL for Data Aggregation
SQL (Structured Query Language) is a common tool for working with databases, and it offers several functions to support aggregation. The most frequently used include:
- SUM(): Calculates the total of numeric values
- AVG(): Finds the average of a column
- COUNT(): Counts the number of records
- GROUP BY: Organizes rows by a shared attribute to apply aggregation
Here’s a simple query example that shows how to use aggregation in SQL:
SELECT region, SUM(sales) AS total_sales FROM sales_data GROUP BY region; Understanding data aggregation with SQL helps automate and scale analytics for organizations handling large datasets.
When to Use and Avoid Aggregation
Although understanding data aggregation is valuable, it’s also important to know its limits. Aggregating too early or too aggressively can obscure important patterns.
Use aggregation when:
- You need high-level summaries or reports
- You are working with dashboards or executive views
- You want to compare large groups over time
Avoid aggregation when:
- You need to identify outliers or exceptions
- You are troubleshooting specific events or transactions
- Granular detail is critical for accuracy
Understanding data aggregation includes knowing when to preserve detail and when to summarize for insight.

Best Practices for Understanding Data Aggregation
To get the most from aggregated data, follow these simple guidelines:
- Choose the right grouping logic to match your analysis goals
- Use clear labels and timeframes in your reports
- Always validate aggregated numbers with raw data when possible
- Update aggregation methods as your dataset evolves
Understanding data aggregation requires both technical know-how and business awareness. The more aligned your aggregation methods are with your goals, the more value they deliver.
Challenges
While the benefits are numerous, there are also challenges to be aware of when applying aggregation methods:
- Loss of Granularity: Aggregation may hide important outliers or unusual patterns.
- Bias in Grouping: Improper categorization or incorrect groupings can skew results.
- Aggregation Errors: Over-aggregating or under-aggregating can result in misleading insights.
Therefore, understanding data aggregation involves not only knowing how to aggregate, but also knowing when it’s appropriate to do so, and ensuring transparency in how data is combined.
How Proxy Services Enhance Data Aggregation Efficiency
Understanding data aggregation is especially relevant when working with proxy services, where requests are often routed through multiple IP addresses to collect data from various sources. Aggregating this proxy-based data allows users to compile region-specific insights, monitor performance metrics, and detect patterns across distributed traffic. For example, businesses using residential proxy services to scrape e-commerce prices can aggregate data by country, product category, or time, enabling clearer market analysis and competitive tracking. In this context, understanding data aggregation ensures that the information gathered through proxies is not only collected efficiently but also turned into actionable intelligence.
Building Long-Term Value by Understanding Data Aggregation
In an era of overwhelming data, the ability to simplify, interpret, and act is a game-changer. Understanding data aggregation empowers organizations and individuals to uncover insights that would otherwise remain buried in noise. It’s a foundational skill in the toolkit of data analysts, developers, marketers, and strategists alike.
From summarizing customer feedback to enhancing machine learning pipelines, aggregation helps focus attention on what matters most. Whether you’re starting small or scaling enterprise systems, putting effort into understanding data aggregation ensures you can move from data collection to data intelligence with confidence and clarity.


